George L. Duarte

Mortgage Loans Fremont California Horizon Financial Associates

  • Home
  • About
    • About
    • Awards
    • Privacy Policy
    • California Privacy Notice
    • Accessibility Statement
  • Reverse Mortgage Library
  • Resources
    • Real Estate Corner Radio Show
    • VA Loans
    • Home Appraisal
    • Home Inspection
    • Loan Checklist
    • Loan Process
    • Mortgage FAQ
    • Mortgage Glossary
    • Closing Costs
    • Loan Programs
    • Living Trusts
  • Reviews
    • Video Testimonials
    • Reviews
    • Write a Review
  • Apply Now
  • Contact

Home Affordability Sinks For The First Time In 12 Months

August 15, 2012 by George Duarte

Home Affordability Index 2012 Q2Rising home prices are taking a toll on today’s home buyers. For the first time in 4 quarters — and despite falling mortgage rates — home affordability is sinking. 

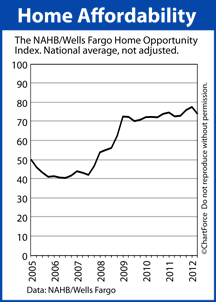
Earlier this week, the National Association of Home Builders reported the Home Opportunity Index, a measure of home affordability, down to 73.8 for the second quarter of the year. This marks the metric’s first “down” quarter since the second quarter of 2011, and is its lowest reading since December 2010.

A home is considered “affordable” when its payments meet standard mortgage underwriting criteria for families earning the local median income. This definition is used for homes across all U.S. markets — including for homes in Chicago.

73.8% of homes sold last quarter were affordable to households earning the national median income of $65,000. This is the 13th straight quarter dating back to 2009 that the index surpassed 70. Prior to 2009, the Home Opportunity Index had not crossed 70 even one time.

Like all real estate data, home affordability varied by locale.

In the Midwest, for example, affordability was highest. 7 of the top 10 most affordable markets nationwide were spread throughout the nation’s heartland. An Alaskan city took the top spot.

The top 5 most affordable cities for home buyers in Q2 2012 were:

  1. Fairbanks, AK (98.7%)
  2. Mansfield, OH (98.1%)
  3. Springfield, OH (95.9%)
  4. Carson City, NV (95.4%)
  5. Kokomo, IN (95.4%)

At #23, Ocala, Florida (91.7%) was the top-ranked South Region city last quarter.

By contrast, the Northeast Region and Southern California remained among the least affordable housing markets nationwide. Led by the New York-White Plains, NY-Wayne, NJ area, 9 of the 10 least affordable areas were in the Mid-Atlantic and California, and for the 17th consecutive quarter the New York metro area was ranked “Least Affordable”.

Just 29.4 percent of homes were affordable to households earning the area’s median income there, down from 31.5 percent three months ago.

The rankings for all 225 metro areas are available for download on the NAHB website.

Filed Under: Housing Analysis Tagged With: HOI, Home Affordability, NAHB

Improving Market Index Spans 32 States, District Of Columbia

August 9, 2012 by George Duarte

Improving Market Index

80 U.S. metropolitan markets are showing “measurable and sustained growth” this month, according to the National Association of Homebuilders’ Improving Market Index.

It’s good news for the economy and good news for housing. 

The NAHB’s Improving Market Index is meant to identify U.S. markets in expansion. It’s a composite of the three distinct data sets which, as a group, present a more holistic view of a given city’s growth :

  1. From the Bureau of Labor Statistics, the IMI tracks employment figures
  2. From Freddie Mac, the IMI tracks home price data
  3. From the Census Bureau, the IMI tracks single-family building permits

The home builder trade group compiles this data and, in order for a given metropolitan area to earn the label “improving”, the area must meet two specific growth conditions.

First, in a given city, each of the above data sets must show growth or expansion in the current calendar month. If one of the three do not show growth, the city cannot qualify.

Second, in a given city, at least six months must have passed since the most recent trough of all of the above metrics.  It’s this second clause that can make the Improving Market Index meaningful.

By focusing on long-term growth trends within a city, the IMI ignores “blips” and seasonal irregularities. 

The August IMI shows 80 improving markets nationwide, a 4-city decrease from July 2012. 5 new cities were added to the index including Miami, Florida; Terre Haute, Indiana; and Lubbock, Texas. Nine cities fell off the list.

Overall, 32 states are represented in the IMI, and the District of Columbia, too.

For today’s Minneapolis home buyers, the IMI doesn’t provide much actionable information. It doesn’t show home prices, for example, nor the current demand for homes. What it shows is the strength of local economies, though, and in many cases, as the economy heats up, so do home prices.

The complete Improving Markets Index is available for download at the NAHB website.

Filed Under: Housing Analysis Tagged With: IMI, Improving Market Index, NAHB

« Previous Page

Sidebar

George L. Duarte

MBA, CMC, CMHS
Call 510.377.9059
Fremont, CA

California DRE Corp Lic no. 01032295
DRE Personal Brokers Lic. No. 00943635
NMLS Corporate Lic. No. 302358
Personal Lic. No. 302219

Horizon Financial Associates LogoView Lending CertificateNAMB Member Certificate

Get a Rate Quote
Mortgage Refinance Companies
NAMB
Proud Supporter Of Our Military
CMC Logo

Stay up to date with the latest news to your inbox!

No spam ever and you can unsubscribe anytime.


Horizon Financial Associates BBB Business Review

Connect with Me

Browse Articles by Category

Mortgage Pros2019 Best of Fremont2017 Best of Fremont2016 Best of Fremont

See More Awards →

Recent Articles

  • Millennials and the Pursuit of Homeownership
  • What’s Ahead For Mortgage Rates This Week – January 29th, 2024
  • Are You Ready for Home Ownership? Find Out by Answering These 4 Questions
  • Maximizing Your Mortgage: Unveiling Strategies for Faster Payoff and Interest Savings
Horizon Financial Associates is a BBB Accredited Mortgage Broker in Fremont, CA
Equal Housing Opp
crb logo REALTOR Logo


39488 Stevenson Pl Ste. 100
Fremont, CA 94539

Copyright © 2026 · Powered by MySMARTblog

Copyright © 2026 · Genesis Sample Theme on Genesis Framework · WordPress · Log in